asus pn50 and cpufreq/boost

I’ve been using an ASUS PN50 (that’s a mini pc, with an AMD Ryzen 4800u processor – so sort of a laptop without a screen) as my desktop for ages.

Increasingly I’ve found it sluggish and I was contemplating replacing it with something newer, and then I discovered why the CPU speed in /proc/cpuinfo was always 1400mhz….

I needed to :

echo 1 > /sys/devices/system/cpu/cpufreq/boost

Once that’s done, the CPU cores can go up to about 4.2Ghz … #doh

In other news – https://www.phoronix.com/news/Linux-Per-Policy-CPUFreq-Boost looks interesting.

Unfortunately now my minipc’s fan is always speeding up / slowing down when it used to be pretty quiet :-/

Thanks to https://www.reddit.com/r/MiniPCs/comments/16cuzd8/asus_pn50_unlock_cpu_speed_under_linux/

faster rsync (ssh cipher choice)

Perhaps the bottleneck isn’t always bandwidth – but does changing ssh cipher make any difference?

Using a derivative of :

rsync -W --delete --no-owner --no-group --no-perms \
    -e ssh \
    -arv /source/ remote@destination:/destination/path/

In unscientific tests, it looks like ssh parameters might do something when copying a 4GiB file between two random virtual machines in different data centres, but both in London.

SSH Variant Speed
-e “ssh” ~45MB/s
-e “ssh -x -T” ~44MB/s
-e “ssh -x -T -c chacha20-poly1305@openssh.com” ~42MB/s
-e “ssh -x -T -c aes128-ctr” ~47MB/s
-e “ssh -x -T -c aes256-gcm@openssh.com” ~50MB/s
-e “ssh -x -T -c aes128-gcm@openssh.com “ ~45MB/s

I’m not sure if these results are particularly insightful / useful.

docker proxy image download

Docker doesn’t like me for some reason, and I often get really bad download speeds from my home IP address.

One crude fix, is use an external server I can access as a SOCKS proxy.
To do so, edit / create /etc/systemd/system/docker.service.d/http-proxy.conf and put in it :

[Service]
Environment="HTTP_PROXY=socks5://localhost:8888"

Then, restart/reload systemd ( systemctl daemon-reload ; service docker restart )

Then, setup your socks tunnel using some remote server you have SSH access on –

ssh -D 8888 david@some.remote.server

Hopefully now when you do a ‘docker-compose up‘ it won’t take forever.

A crude way of speed testing it, is to try running this bash snippet :

token=$(curl "https://auth.docker.io/token?service=registry.docker.io&scope=repository:library/mysql:pull" | jq -r .token)

curl -v https://registry-1.docker.io/v2/library/mysql/blobs/sha256:2a72cbf407d67c7a7a76dd48e432091678e297140dce050ad5eccad918a9f8d6 -H "Authorization: Bearer $token" -L > /dev/null

FTTC limited by wifi….

Compare :
random speedtest result on ethernet

(Speedtest over ethernet)

with

random speedtest result on wifi

(Speedtest over wifi).

Now how do I go about getting Sky to giving me a wifi router box thing that does 802.11n or whatever?

MySQL update/write query analysis (query profiling)

Do you have a slow MySQL update/insert/delete query?

Obviously, for ‘SELECT’ queries you can prepend the query with “EXPLAIN ” – however that doesn’t work for the other query types (UPDATE/INSERT/DELETE).

So, one solution which may explain why the query is slow is to turn on MySQL’s profiling functionality, like in the following example :
Continue reading “MySQL update/write query analysis (query profiling)”

Zend_Cache – automatic cache cleaning can be bad, mmkay?

$customer uses Zend_Cache in their codebase – and I noticed that every so often a page request would take ~5 seeconds (for no apparent reason), while normally they take < 1 second …

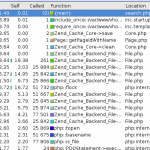
Some rummaging and profiling with xdebug showed that some requests looked like :

xdebug profiling output - note lots of zend_cache stuff

Note how there are 25,000 or so calls for various Zend_Cache_Backend_File thingys (fetch meta data, load contents, flock etc etc).

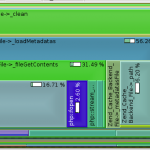
This alternative rendering might make it more clear – especially when compared with the image afterwards :

zend cache dominating the call map

while a normal request should look more like :

a "normal" request - note Zend_Cache is not dominating

Zend_Cache has a ‘automatic_cleaning_mode’ frontend parameter – which is by default set to 10 (i.e. 10% of all write requests to the cache result in it checking if there is anything to garbage collect/clean). Since we’re nearly always writing something to the cache, this results in 10% of requests triggering the cleaning logic.

SeeĀ http://framework.zend.com/manual/en/zend.cache.frontends.html.


The cleaning is now run via a cron job something like :

$cache_instance->clean(Zend_Cache::CLEANING_MODE_OLD);


Checking varnish configuration syntax

If you’ve updated your varnish server’s configuration, there doesn’t seem to be an equivalent of ‘apachectl configtest’ for it, but you can do :

varnishd -C -f /etc/varnish/default.vcl

If everything is correct, varnish will then dump out the generated configuration. Otherwise you’ll get an error message pointing you to a specific line number.