$customer uses Zend_Cache in their codebase – and I noticed that every so often a page request would take ~5 seeconds (for no apparent reason), while normally they take < 1 second …
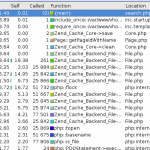
Some rummaging and profiling with xdebug showed that some requests looked like :

Note how there are 25,000 or so calls for various Zend_Cache_Backend_File thingys (fetch meta data, load contents, flock etc etc).
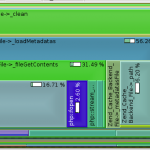
This alternative rendering might make it more clear – especially when compared with the image afterwards :

while a normal request should look more like :

Zend_Cache has a ‘automatic_cleaning_mode’ frontend parameter – which is by default set to 10 (i.e. 10% of all write requests to the cache result in it checking if there is anything to garbage collect/clean). Since we’re nearly always writing something to the cache, this results in 10% of requests triggering the cleaning logic.
See http://framework.zend.com/manual/en/zend.cache.frontends.html.
The cleaning is now run via a cron job something like :
$cache_instance->clean(Zend_Cache::CLEANING_MODE_OLD);
Great post. Had the exact same issue on a client project. What’s is that awesome visual image tool you are using to create those graphs from xdebug?
Jim – they’re just screenshots from KCacheGrind. It’s a Linux tool – although I believe there are equivalent ports for Windows and OSX.